HTML Report
quellog's HTML report is a single, self-contained file: open it in any browser, no server, fully offline. Everything — filtering, zooming, drilling into a query — happens client-side in the page.
Try it now
Open the interactive demo → — drop a PostgreSQL log file and explore. All processing runs locally in your browser.
Generating the report
quellog /var/log/postgresql/postgres.log --html          # → postgres.html
quellog /var/log/postgresql/*.log --html -o report.html  # explicit name
quellog /var/log/postgresql/*.log --html --full          # all sections
quellog /var/log/postgresql/*.log --html --open          # open it in the browser
The default name is <stem>.html for a single input, quellog.html for multiple inputs or stdin. --open launches the default browser (skipped when stderr is not a TTY or CI is set). The HTML report can also be produced alongside other formats in a single pass — see Export Formats.
Anatomy
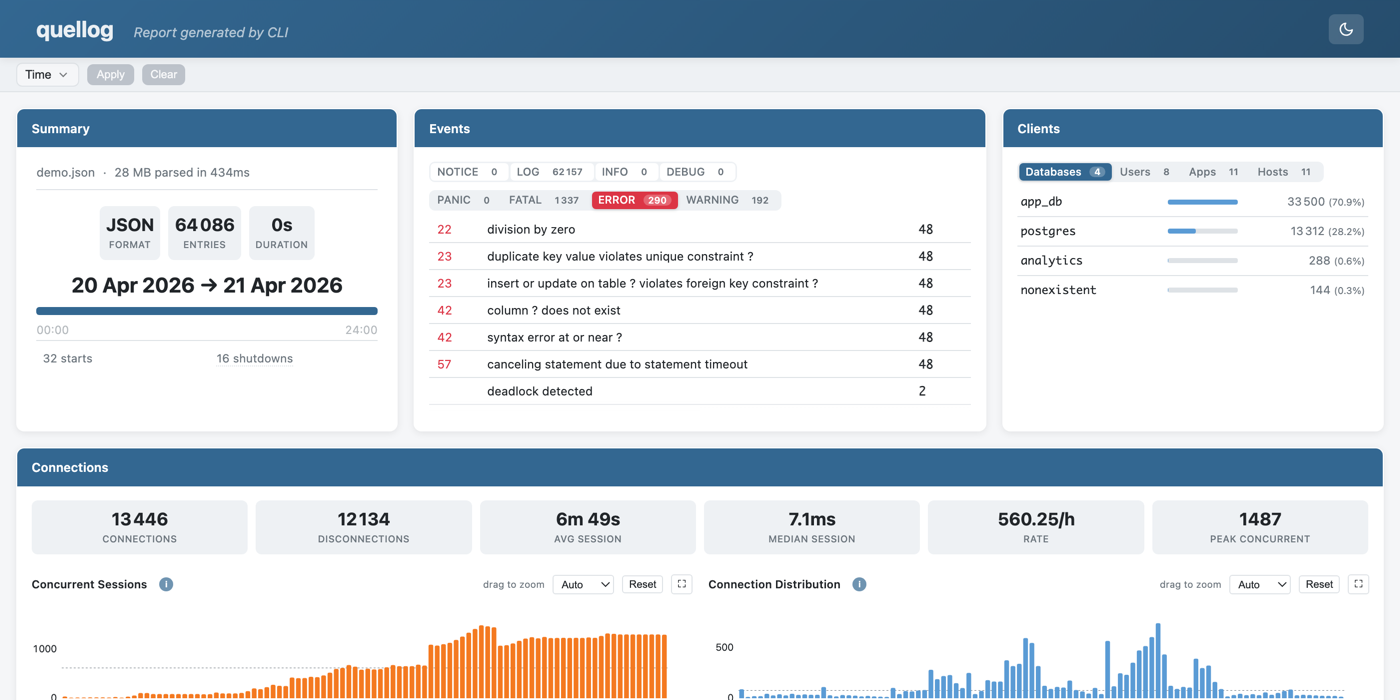
A header (file name, theme toggle), a client-side filter bar, then the Summary tile and the analysis sections — Events, SQL Performance, Connections, Maintenance, and the rest. These are the same sections as the text report (Report Sections), rendered interactively.
Summary tile
The eyebrow line shows format, total size, parse time and the date range; a full-width bar marks the data span. When the report is split into periods, this tile also carries the period navigator (see below).
Client-side filters
The filter bar filters the whole report by database, user, application, host and time range. Applying a filter re-renders every section and chart instantly, in the browser — no need to re-run quellog.
Interactive charts
Every time-series chart shares the same toolbar:
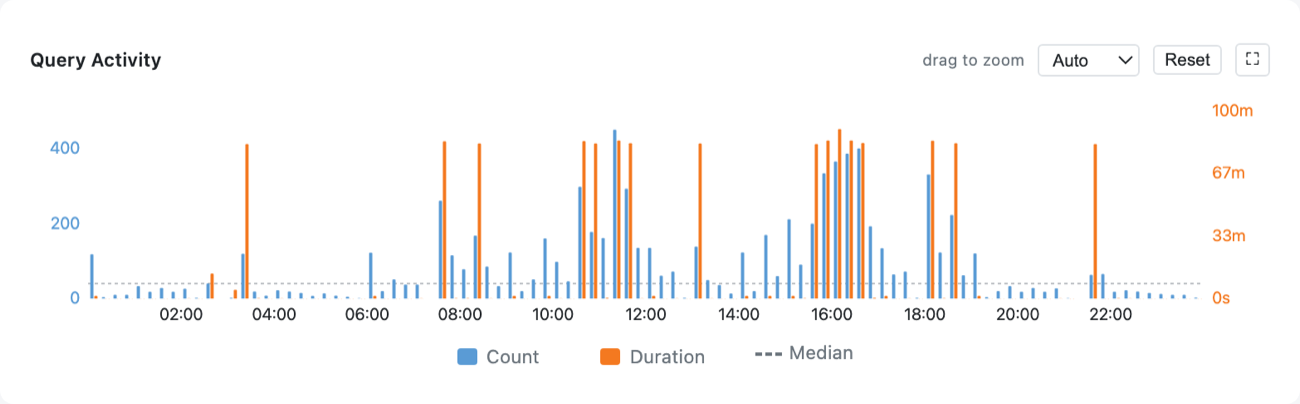
- drag to zoom — drag horizontally to zoom into a time window.
- double-click or Reset — restore the full range.
- interval selector (Auto / 1 min / 5 min / …) — change the bucket width.
- ⛶ — expand the chart in a large modal, where ⬇ Export PNG saves it as an image.
- legend entries toggle a series on/off.
Charts include Query Activity (count + cumulated duration), Concurrent Sessions, Connection Distribution, Checkpoints, WAL distance, and Temp File activity.
Cost map
Under SQL Performance, the cost map plots every query (TCL excluded) on log-log axes — execution count (X) against average duration (Y):
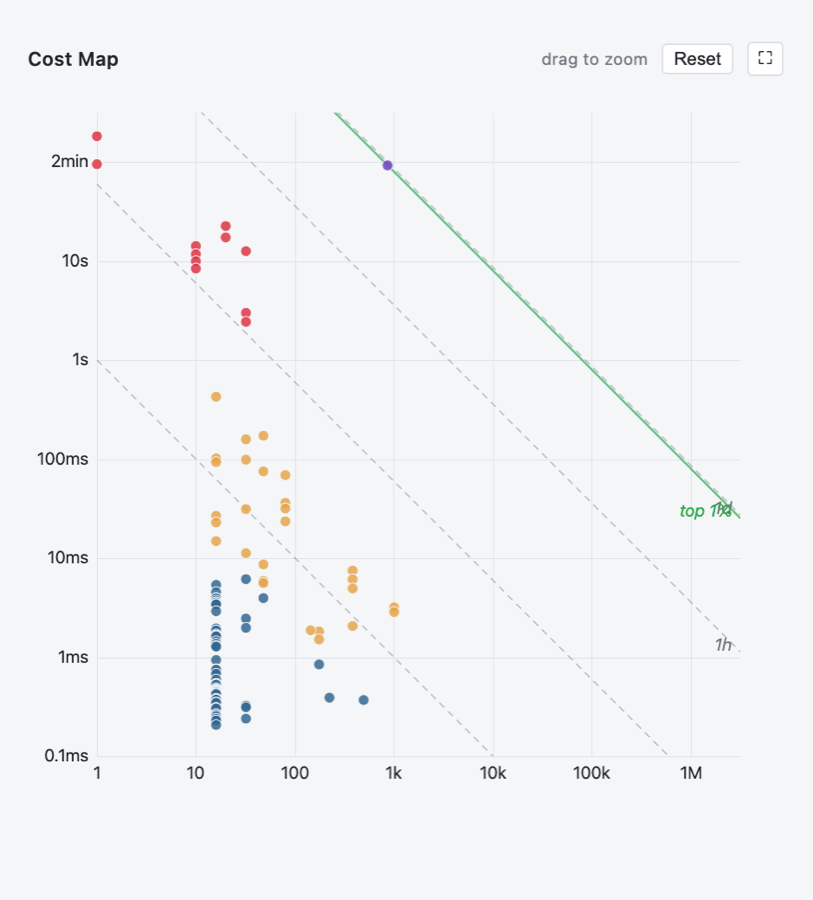
- Each dot is a normalized query, coloured by its cumulative time (count × avg) in four buckets (low → extreme).
- The dashed iso-cost diagonals mark constant cumulative time (1s / 1min / 1h / 1d); the solid green top 1% / 10% lines are Pareto thresholds — dots above and to the right account for that share of total query time.
- Hover a dot for its figures and to highlight its row in the query table (and the reverse); click to open its detail. Drag to zoom, double-click to reset, ⛶ to expand.
Heavy hitters sit toward the top-right, so the map answers "which queries cost the most overall?" at a glance.
Query tables and detail
The query tables (By Total Time / Slowest / Most Frequent, plus a TCL tab) are sortable. Click any row — or any cost-map dot — for the query detail modal:
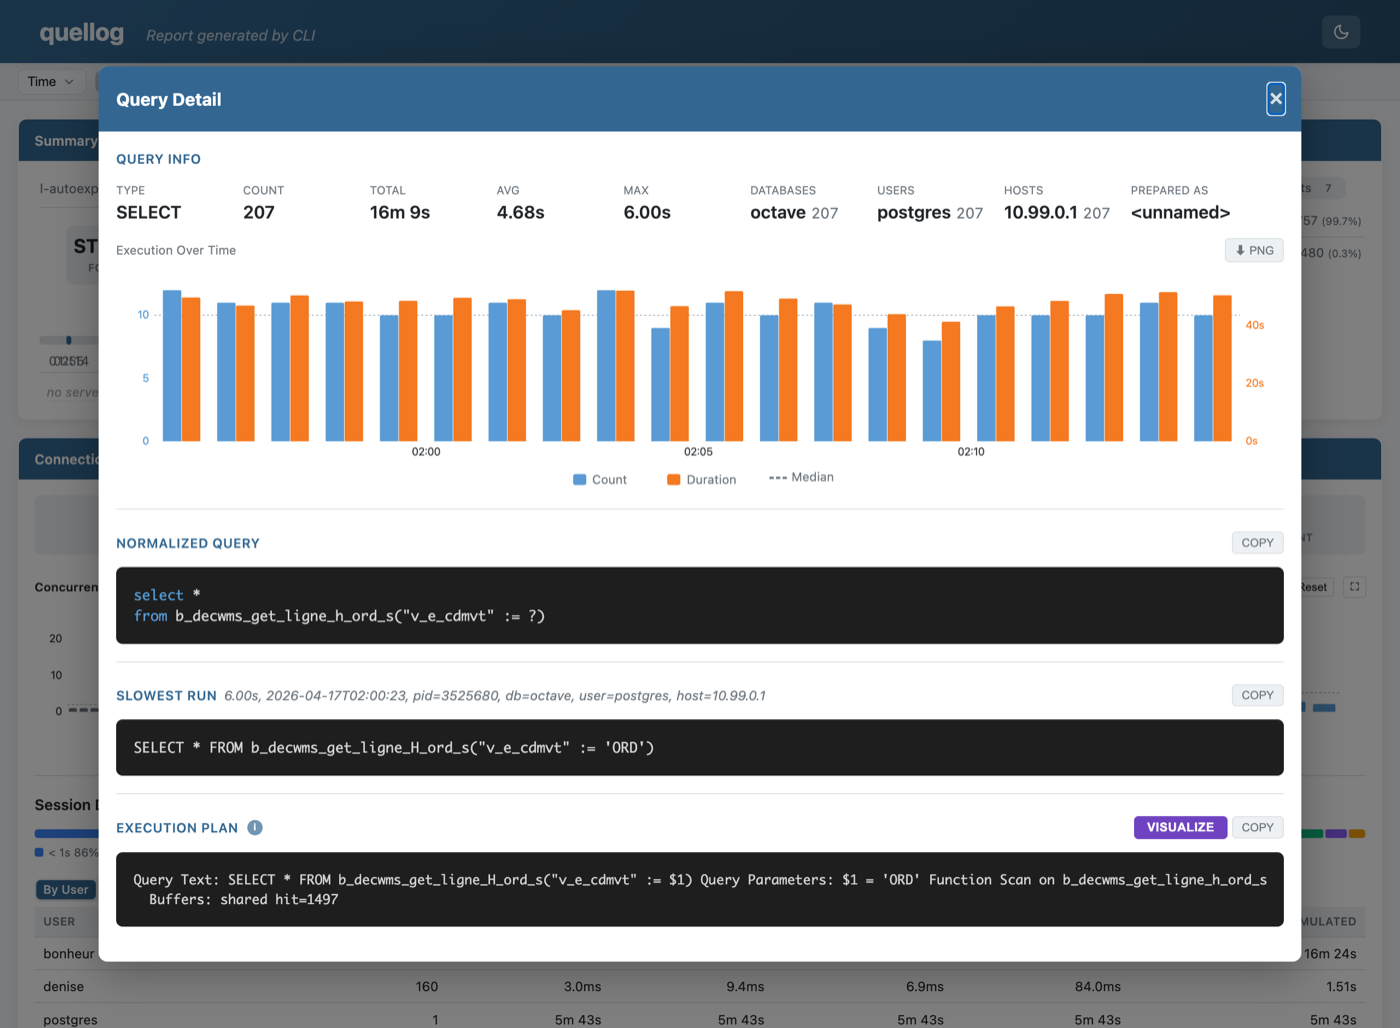
It cross-references every analyzer for that query: duration distribution and an execution-over-time chart, top databases / users / applications / hosts, prepared-statement names, the slowest run with its actual parameter values, the temp files and locks it caused, and the captured execution plan (with a Visualize button to explain.dalibo.com). Normalized and example queries have copy buttons.
Event detail
Click any event row for the event detail modal:
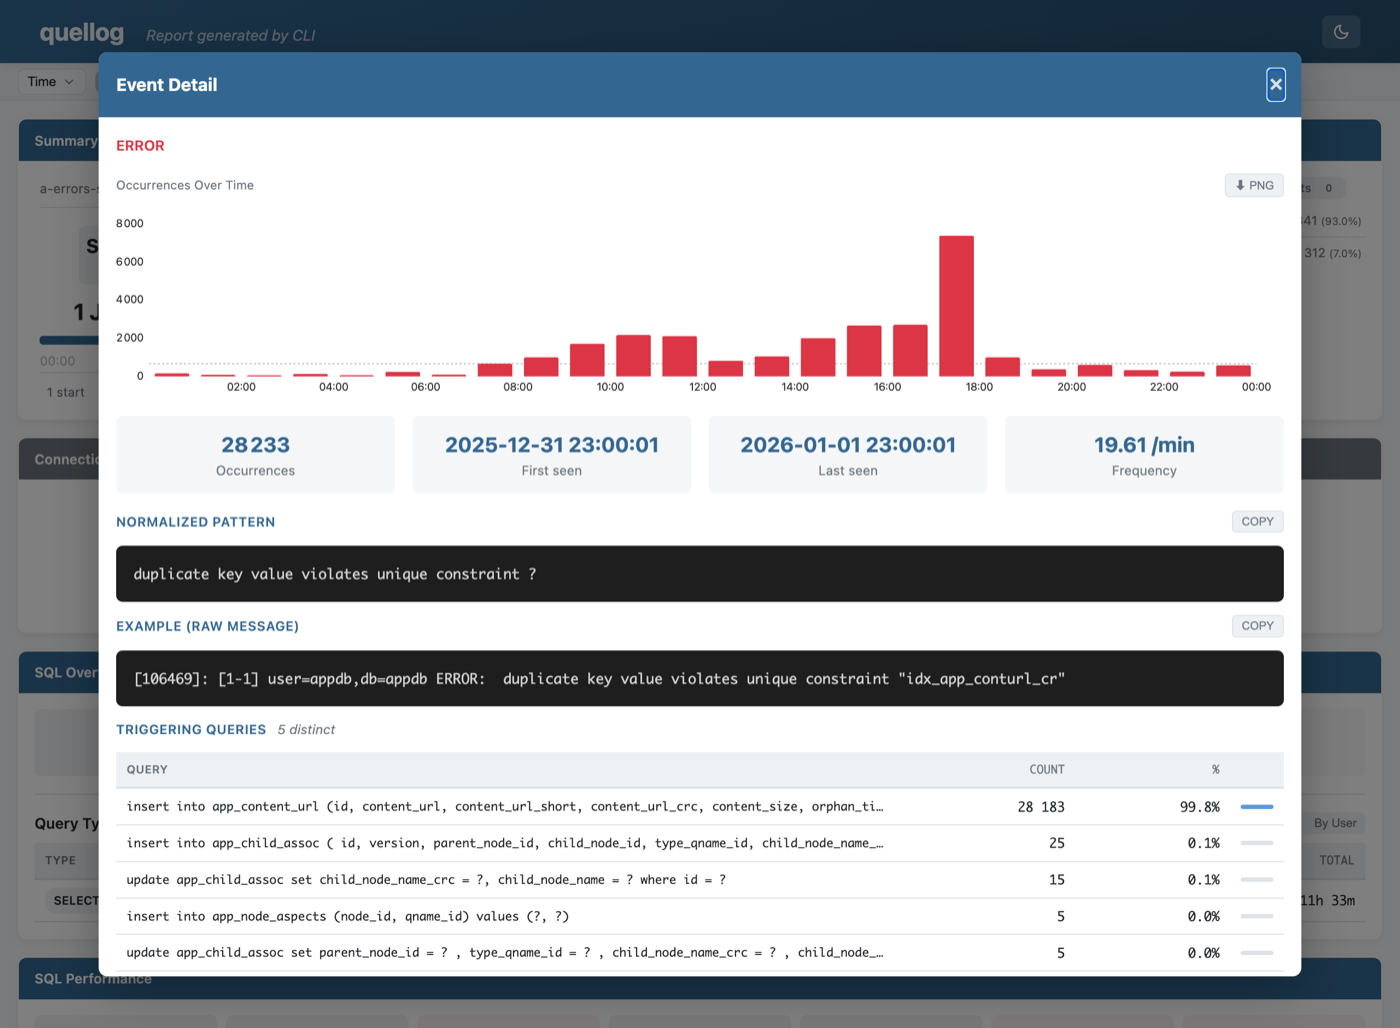
It shows the normalized pattern and the raw example (both with copy buttons), an occurrences-over-time sparkline, first/last seen and frequency, the SQLSTATE class, and — when the offending statements were logged — the triggering queries ranked by share.
Maintenance and other widgets
The Maintenance section splits AUTOVACUUM and AUTOANALYZE into tab-switchable, sortable tables; a long table name expands on click. Connections add the concurrent-sessions chart and session breakdowns by user / database / host.
Period-split reports (--split)
--split <interval> turns one run into a single HTML report partitioned into selectable time periods. Each period is analyzed independently, so its numbers match a run scoped to that window with --begin/--end.
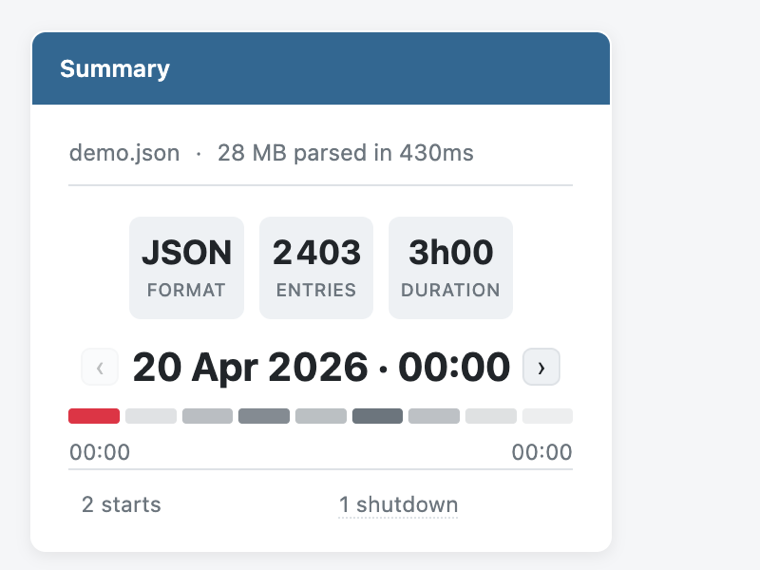
The Summary tile gains a period navigator with a volume heatmap — one cell per period, coloured by entry count. Click a cell (or the ‹ › arrows) to switch period; nothing reloads.
quellog /var/log/postgresql/*.log --html --split 1d   # one period per day
quellog logs/2026-02-*.log        --html --split 3h   # 3-hour periods
quellog busy-hour.log             --html --split 5m   # 5-minute periods
The interval takes the same units as --last (s, m, h, d, w, y), one unit at a time (90m, not 1h30m). Periods align to the log's wall clock — 1d to local midnight, 3h to 00:00/03:00/06:00…, 5m to :00/:05/:10 — independent of the machine timezone.
- Requires
--html, and cannot be combined with the other export formats or with--follow. Only the full report is supported (not--sql-detail,--event-detail,--sql-performance,--sql-overview). - Filters (
--begin/--end,--dbname, …) apply before splitting, so periods cover only what passes the filters. - At most 400 periods are produced; a too-fine interval over a long range is rejected — use a coarser one.
Theme
A light/dark toggle in the header switches the whole report; it follows the operating-system preference by default.